Lying with charts has become a normal scientific practice which I have been writing a lot recently.
It is actually a pretty clever rhetorical technique, assuming you want to make a point and not actually inform people about reality.
Lying with charts is simply a variation of lying with statistics, and it can be an even more effective technique if you are willing to be dishonest. This is because charts exist in order to make statistics even more easily digestible than simply providing data in a number, and better still than providing the original dataset which looks like a confusing matrix of numbers that for most people is impossible to make heads or tails of.
This is precisely the reason charts are used. They make the incomprehensible into something simple and visual. They have impact, and if you are conscious about how to design them
Salesforce has a simple explanation for why you should use visualizations to communicate a point, as well as advice on what visualizations to use in order to maximize the impact:
You’ve got data and you’ve got questions, but what’s the best way to visualize that data to get the answers you need? Transforming data into an effective visualization or dashboard is the first step towards making your data make an impact.
As Henry D. Hubbard, Creator of the Periodic Table of Elements said, “There is magic in graphs. The profile of a curve reveals in a flash a whole situation — the life history of an epidemic, a panic, or an era of prosperity. The curve informs the mind, awakens the imagination, convinces.”
So let’s take a look at what scientists have been doing to “awaken the imagination” for people on a topic about which they very much want to convince you of their point.
Greenpeace co-founder, Dr. Patrick Moore, demonstrates how climate change alarmists exaggerate negligible rises in temperature to create the illusion of impending climate apocalypse.
"This has not been a very significant change in global temperature. The last 300 years is when… pic.twitter.com/FELpeQNxA5
— Wide Awake Media (@wideawake_media) July 26, 2023
Let me break down the deception for you, as I have done in the past with other graphs and charts.
Let’s say you want to scare the bejeezus out of people regarding the impending doom that awaits unless we turn the West into a socialist hellhole. “Climate change is going to kill us all!”
You produce a graph like this:
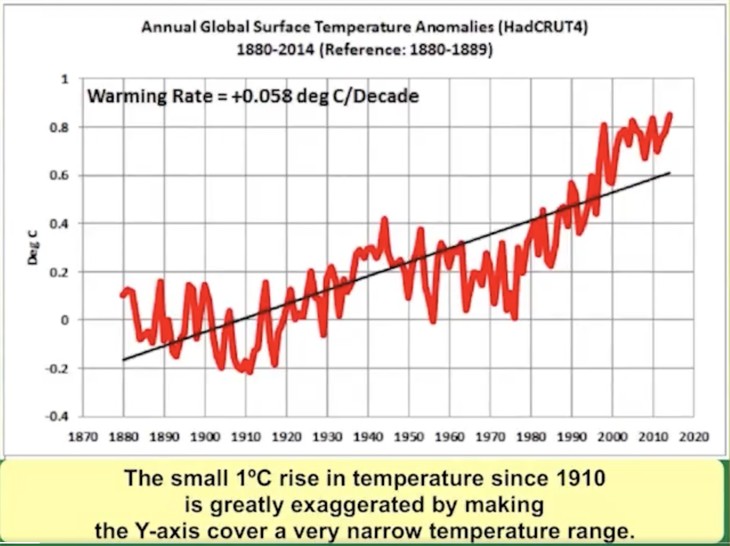
You have a scary red line rapidly rising to the sky. Look at that plot! Doom is around the corner, and unless you get rid of cars, air conditioning, gas appliances, and your freedom the Earth will cook and become uninhabitable.
It really is scary, isn’t it?
Now look at a chart derived from the same data. It shows temperatures on Earth over the past 150 years, and if you know what you are looking at it will give you basically the same information in a very different context–one that covers temperature differences over 150 years but also tells you the temperature RANGE over those years at a specific place. Each year temperatures range from about 10 degrees to 90 degrees due to seasonal and weather variations.

The approximate 1-degree increase is lost within the noise.
In a sense, neither chart gives you the picture you need to get a sense of whether the variation in global temperatures (whatever that means) is unusual (it isn’t, over medium-term time scales) or worrying (it isn’t, because “global temperature” variations over a thousand or so years swing back and forth more than that one degree, so the signal if it exists is buried within the noise in the data).
A 150-year dataset is, in reality, pretty worthless unless the signal is huge, since climate variation over the medium term is pretty large, and over a longer term (tens of thousands of years) is huge. Remember that the Younger Dryas ended about 12,000 years ago, and much of the Earth was covered in ice a mile thick, and sea levels were 450 feet lower than today. Human beings had been walking the Earth for over 200,000 years before the Earth warmed up, and civilization didn’t even begin until that happened.
Imagine what climate scientists, if they existed in 12,000 BC, would have warned about then. Sea level rising 450 feet! Doom! Temperatures rising by huge amounts! Death!
What we got was agriculture, cities, and technology beyond spears. Not bad.
As you can see, both of these charts are actually worthless if their purpose is to tell us something that is useful to understand if our concern is figuring out if we have something to worry about when it comes to CO2. The dataset is too short, the phenomena are too complex, and our models to extrapolate from the available data are too crude.
But each serves its intended purpose. The first to scare you, the second to debunk the first. Now I agree with the intent of the second chart, but actually, I would rate its scientific usefulness as no better than the first. Both are useful rhetorically, but if you want to know if human beings are actually baking something into the cake when it comes to changing climate, all this data visualization is worse than worthless.
Unfortunately, most of what we call “science” is rhetoric intended to persuade. Do this, don’t do that, can’t you read the signs?
Yesterday I wrote about the crisis in modern science, and if anything it is worse than I portrayed. Science itself is a modern marvel. Scientists, though, are human beings like the rest of us, and we have to sort out the honest from the dishonest. And the incentives for modern scientists reward advocacy, on honesty.
Fox Mulder was right: trust no one.


Join the conversation as a VIP Member