You have to admit these guys are good at lying.
Want to see some world-class propaganda? As in scientists proving to all of us what complete tools they are?
Steve Milloy of Junk Science has an example that will blow your socks off:
Here's a chart from the Lancet Planetary Health🙄 study.
Note how the chart is made to look as if heat deaths are as big or even a bigger problem than deaths from cold in some countries.
Can you spot the deception? Even I initially missed it. 2/ pic.twitter.com/7d7duJwf63
— Steve Milloy (@JunkScience) July 25, 2023
The Lancet, for those of you not in the know, is one of the premier medical journals in the world. They are in competition with the New England Journal of Medicine for the top spot in prestige.
They are also political hacks and have been for quite a while. It’s both sad and dangerous because we need reliable scientific journals to aid us in making intelligent decisions about both public policy and health.
So what is so impressive about the propaganda that they are pushing out with this chart? It is so brilliant that even Steve, who spends every day ferreting out BS didn’t notice it at first, so let me show you. I wouldn’t have noticed either, at least not right away.
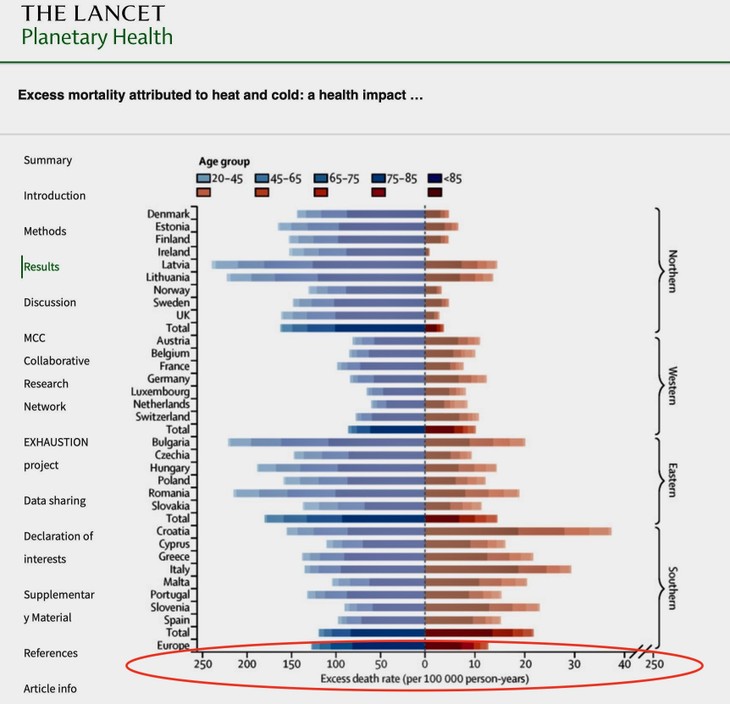
Look at the X-axis. For heat deaths, each increment is 50. For cold deaths, each increment is 10.
So two lines of the same length actually represented 500% more for cold than for heat.
There’s a reason for that, of course, and it is simple: heat deaths are a small fraction of deaths from inclement weather. You are far, far more likely to die from cold than from heat. This is of course a very inconvenient fact for the climate alarmists, of whom, unfortunately, the “scientists” at The Lancet are leaders of the pack, so they just decided to lie with a graph.
As with so many things, they will say “We didn’t lie–you can see the difference in scale written on the bottom!”
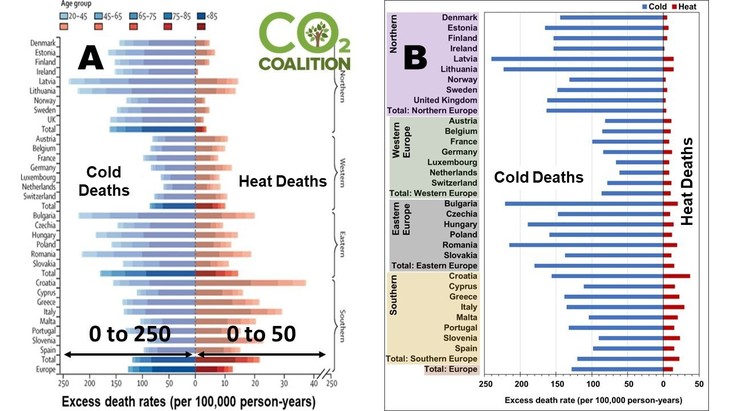
The CO2 coalition put together a chart with the same data but the X-axis standardized, and it looks like this:
Graphs are supposed to be used to provide data in an easily digested form and to be standardized in a way that enhances, not detracts from understanding. That is the very purpose of a graph as opposed to presenting an Excel spreadsheet. Make the data easily digestible.,
And they did that. Only they did that in such a manner as to deceive you, not enlighten you. They have a point they want you to take away, so they fiddle with the metrics in order to lead you astray, like a magician who never exactly lies to you. He just distracts you and creates an illusion.
This is narrative building, not presenting facts, and it is the opposite of what scientists are supposed to do.
Take a look at one line on the chart: Croatia. Roughly speaking the cold deaths and heat deaths look about the same. Yet the actual figures are 35 for heat and over 150 for cold.
Look the same, but almost a factor of 5 different in reality.
Earlier today I wrote about the crisis in science. Lo and behold, Steve Milloy provided me with yet another example of narrative pushing over scientific integrity.
Disgusting.


Join the conversation as a VIP Member